
|
| SPC Interactive: rapid orientation with the convenient user guide. | 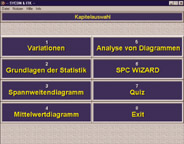 |
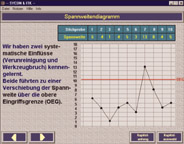
 | Case studies illustrate how meaningful range charts can be in the production process |
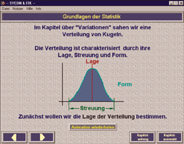
| On beginning the program, users get a fundamental course in Basic Statistics | 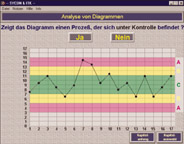 |
 | Average (Xbar) charts help to find systematic influences that can be the cause of variance. |
| Practice in diagram analysis has game appeal | 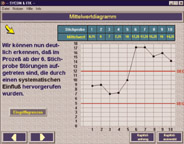 |
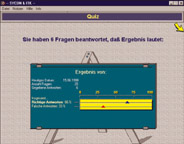 | Quiz at the end helps retain the newly learned information. |
| »Download Product Presentation | »Download Demo Version |